
The AIS data used in this study are taken from archived files from AISHUB [5], that are downloaded every five minutes and contain some ten million data points worldwide per day. An AIS data record contains various information about the ship that sends it; relevant for this analysis are the fields date/time, latitude, longitude, sog (speed over ground), cog (course over ground) and heading. For this study AIS data in the time period March up to and including September 2024 were used. Speeds, given in knots, are converted to m/s.
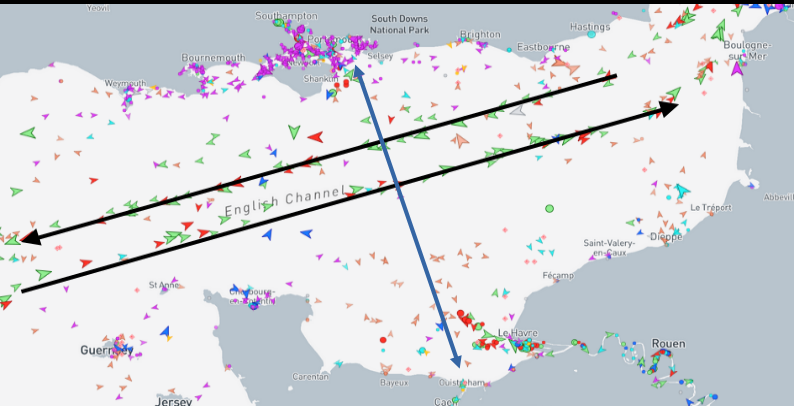
Figure 1 shows the two shipping lanes in the English Channel for longitudes between -3 and +1, where the tidal currents are assessed, as black arrows. Filter criteria to select ships on the west-east lane are: latitude − 0.177×longitude = 50.32 ± 0.05 and course over ground = 75 ± 5 degrees. The east-west lane lies 0.18 degrees more northerly and the mean ship cog is 254 degrees. The blue arrow approximately shows the track of shuttles between Ouistreham and Portsmouth.
The ship data were grouped in passages: time series of consecutive measurements from the same ship with time gaps of no more than 1 hour. To obtain reliable assessments of e.g. the cruising speed of a ship, only passages with at least 50 data points were used. Also, data values that are unrealistic or unsuitable for the analysis, such as speeds higher than 30 or lower than 6 knots, were filtered out.
For comparison, sea surface current hindcast results from the European North West Shelf model, as provided by the Copernicus Marine Environment Monitoring Service (CMEMS), were used. The model data, current vectors (u,v), are given on a spatial grid of 1/36 degrees and at a 15 minute time interval.
Next: Data Preparation.