
A second Hermess proof-of-concept study: surface currents derived from AIS ship data, validated against real current-meter measurements — not just a hydrodynamic model — at a platform in the Sont (Øresund) between Denmark and Sweden.
The Intro through Results tabs cover an English Channel study comparing AIS-derived tidal currents against the CMEMS model. No buoy or platform measurements were available there for validation. This study fills that gap: a platform near the Sont makes detailed current measurements available, with busy shipping lanes passing about a kilometer to either side — a rare opportunity to check AIS-derived currents against the real thing rather than another model.
Data were collected in the north entrance of the Sont, between Denmark and Sweden, chosen for its busy shipping lanes passing close to a current-measuring platform.
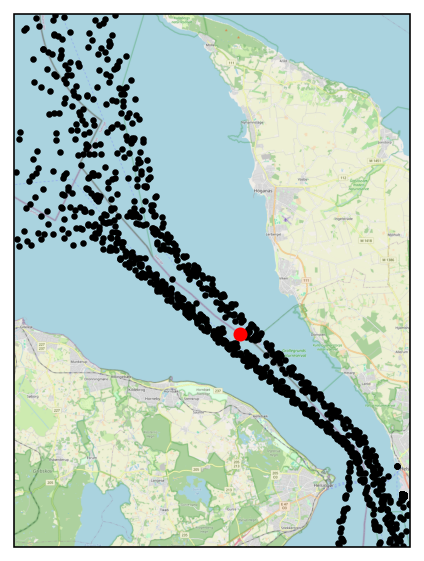
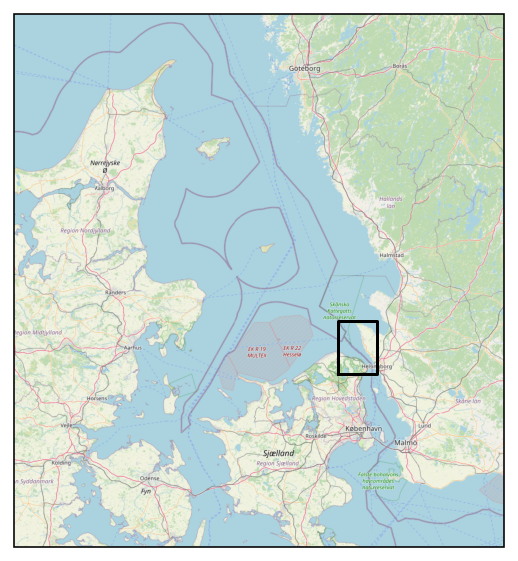
AIS data were selected between 56.06°N and 56.16°N, where the shipping tracks run straight, with a course over ground of 131° (southeast) or 315° (northwest). This yielded 730 southeast and 629 northwest passes — roughly one per hour in each direction. Median speed over ground and date/time were computed per pass.
From the platform's measured speeds and directions, along-currents (towards the northwest) and cross-currents (towards the northeast) were calculated for comparison; the same was done with the model results.
If every ship had the same log speed (speed relative to the surrounding water), the along-track surface current would simply be speed over ground minus log speed. With ships sailing in both directions along the same lanes, that gives:
current_nw ≈ (sog_nw − sog_se) / 2
In practice log speed varies between ships; treated as noise, filtered out. The technique was tested previously on AIS data in rivers. Filtering is applied to the median-speed-over-ground time series (one value per pass); passages with large deviations from the assessed log speed are removed before smoothing, so they don't disturb the filter.
Median speed-over-ground values per pass (black dots), a Savitzky–Golay-filtered version (blue), and — for comparison — the platform-measured current in that direction plus the lane's median sog (red):
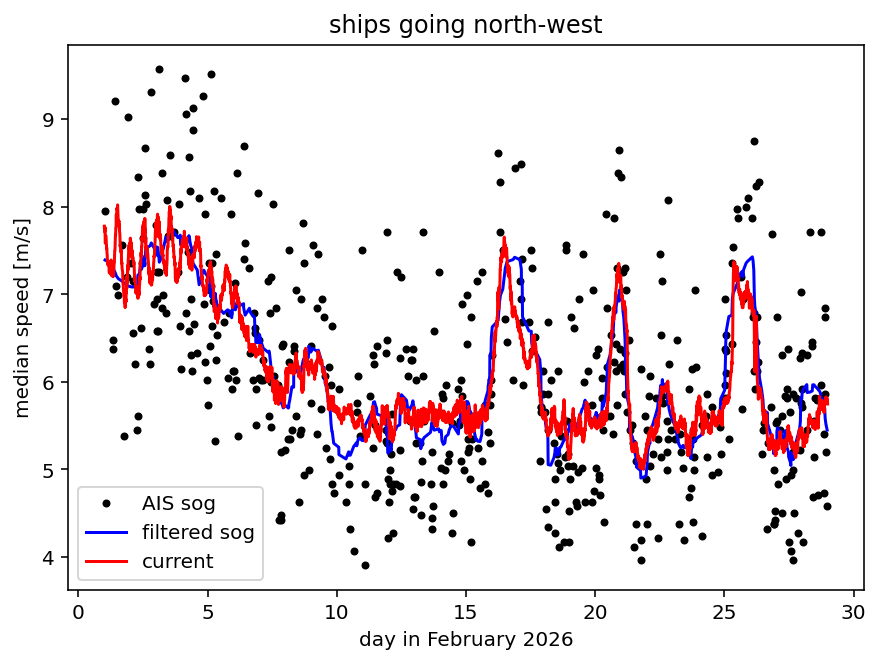
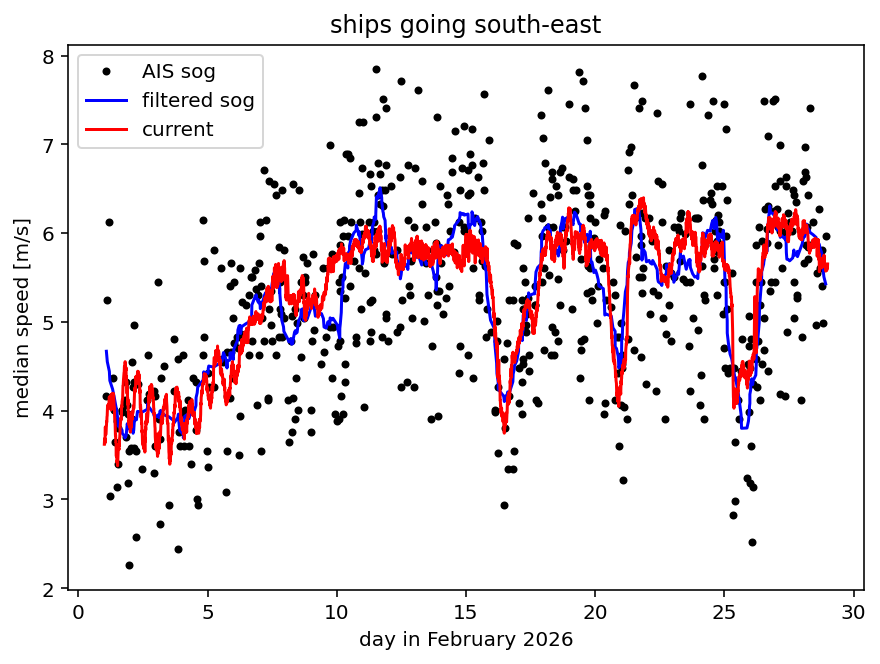
The filtered sog values track the current observations surprisingly well — filter parameters were chosen ad hoc, so there's likely room to improve this further. Combining both lanes (filtered speeds interpolated onto a common time grid, then subtracted per the along-current equation above) gives a northwest-current estimate to compare against both the platform observations and the Baltic model:
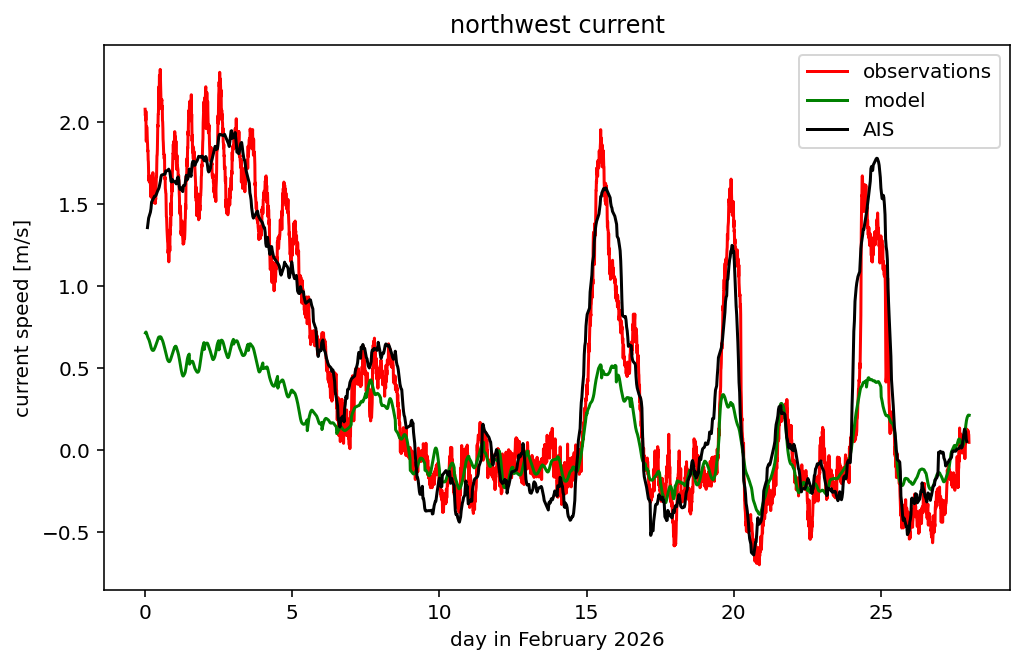
The AIS-derived estimate agrees well with the platform observations on slower time scales, though tidal variations get smoothed out by the filtering. The Baltic model noticeably underestimates the strong speed variations at this location — the AIS-derived estimate tracks the observed peaks (including three sharp events around days 16, 20, and 25) much more closely than the model does. Figure 2 shows that even a single shipping lane, on its own, already gives a fair estimate of the surface current.
This tab shows static results from the Sont proof-of-concept study
(docs/sont.pdf). As with Results, dynamic/interactive plots
against a live or updateable dataset are possible future work, not implemented
yet (see aiscurrents/validation/).
See Intro for the earlier eddy/tidal/river proof-of-concept references.